
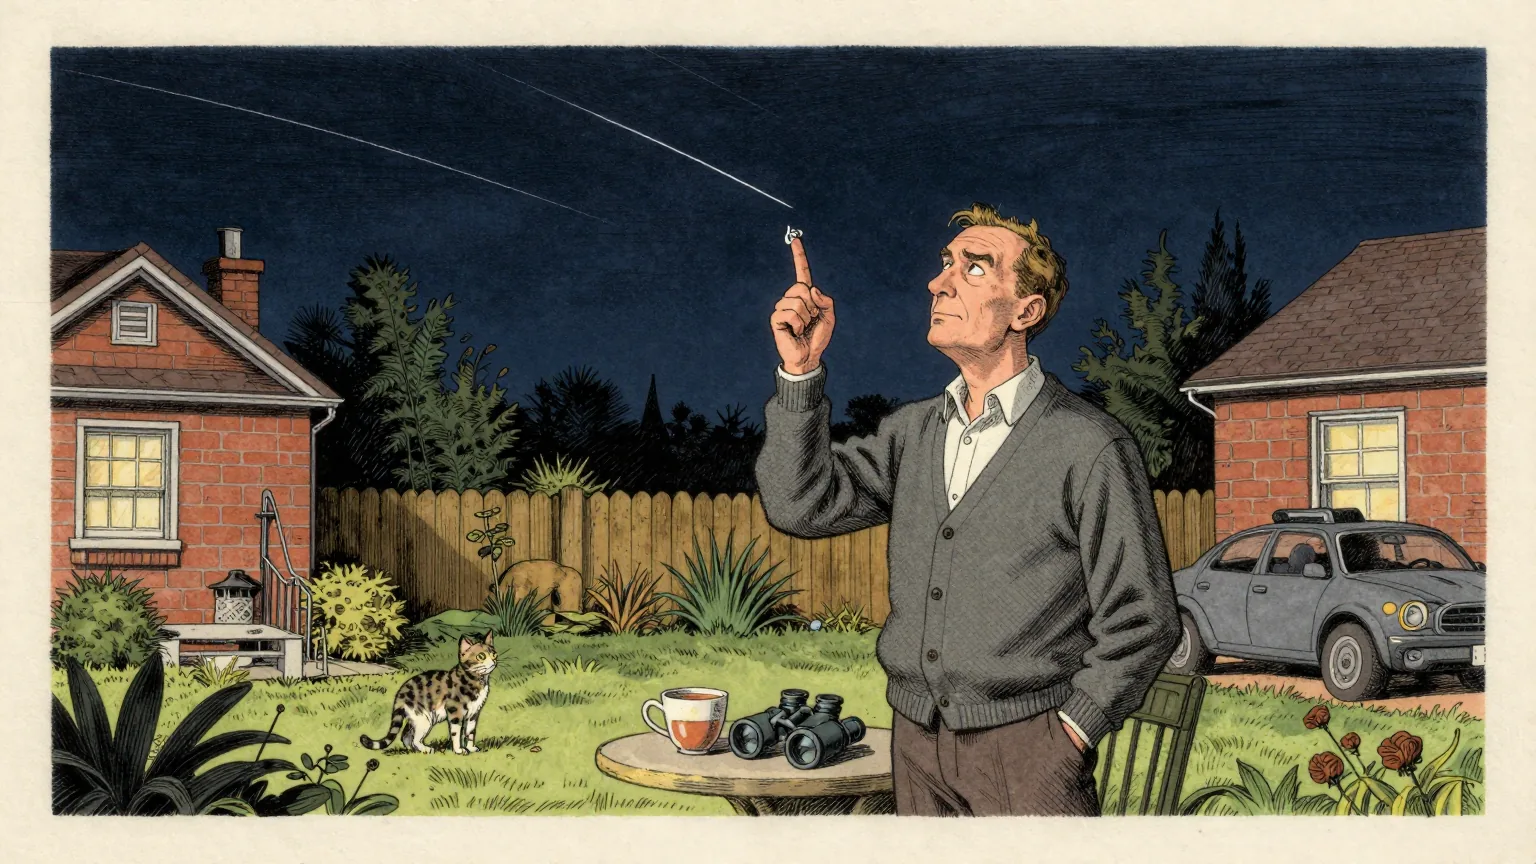
An astronomer has found a way to measure the density of the upper atmosphere by watching satellites sink into it.
Dr Tony Phillips, who runs spaceweather.com, is tracking the orbital decay of more than two thousand spacecraft: about 1,000 Starlink satellites, 651 Eutelsat OneWeb, 391 Amazon Kuiper and 107 Planet Labs SuperDoves.
The measurement relies on a number that already exists. Public tracking data for objects in orbit includes a drag term, known as B-star, which is adjusted so that the predicted orbit matches the observed one.
The elegance is that nobody had to build anything. Two-line element sets are published continuously for objects in orbit, and the drag term inside them is already being fitted to reality several times a week, for reasons that have nothing to do with atmospheric science.
When solar ultraviolet radiation heats the thermosphere, the atmosphere expands. Satellites then meet more of it than the model expects, slow more than predicted, and the B-star term is revised upwards to compensate.
That revision is the reading. Aggregated across thousands of satellites, it becomes a continuous record of how dense the top of the atmosphere is.
The record follows the sun closely. Sink rates track the sun's 10.7cm radio flux with a lag of about two days. “The upper atmosphere takes about two days to answer a change in the sun,” Phillips said.
Geomagnetic storms appear differently, as sharper and faster spikes of expansion.
The four fleets are useful precisely because they are large, uniform and in similar orbits. Thousands of near-identical objects at similar heights make a better instrument than a handful of bespoke ones, because the common signal stands out from the noise of any individual satellite’s manoeuvres.
The stakes are not abstract. A geomagnetic storm in 2022 cost 40 Starlink satellites shortly after launch, when a thickened atmosphere pulled them down before they could raise their orbits.
“Using this new data stream, we can watch the atmosphere breathe,” Phillips said.
Consider what sort of instrument this is. A barometer conventionally sits on a wall and is consulted. This one is in orbit, there are thousands of it, and every reading is taken by the instrument being very slightly destroyed.
The sensitivity is therefore inverted. A thicker atmosphere produces a stronger signal because it does more damage, which means the array is most informative about exactly the conditions it is least likely to survive.
Our analysts regard the design as sound in all respects but one. The sensor network is maintained by commercial operators who replace their satellites for entirely unrelated reasons, at their own expense, on a schedule the atmosphere has no need to be told about. No meteorological agency has ever enjoyed a calibration budget of that kind.
The 2022 storm remains the closest thing the network has to a full-scale test. Forty instruments reported a thickened atmosphere. All forty reports were correct, and all forty were final.
The Department of Unnecessary Research notes that the output requires no training to interpret. The satellite is at a certain height. The atmosphere is at the same height. The difference between those two statements is the measurement.